Curated Alpha for Traders
Get the latest news and analysis on Bitcoin mining and hashprice trading in your inbox every other week. No spam. Unsubscribe anytime.
BLOG
Get the latest news and analysis on Bitcoin mining and hashprice trading in your inbox every other week. No spam. Unsubscribe anytime.
By: Ben Harper, Ethan Vera, and Nícolas Alencar
As the largest downward difficulty adjustment since the China mining ban of 2021 approached last week (-7.32%), Bitcoin miners were understandably looking forward to some positive news. With bitcoin prices way down and network difficulty way up, hashprice and miner revenues have taken a dive in 2022. This latest difficulty adjustment is the first relief miners have seen in months.
But as the latest difficulty adjustment approached, miners were also tempering their optimism. Sure, Luxor’s Hashrate Index and other sources were projecting a large negative adjustment. But how sure could miners be that this would materialize at the end of the epoch? It is a question that is not only relevant to miners, but all hashrate market participants, particularly traders of Luxor’s recently launched Hashprice Non-Deliverable Forward.
In this analysis, we seek to answer that question. We analyze the past 105 difficulty epochs to construct confidence intervals for projections of upcoming difficulty adjustments. These intervals can then be used by market participants to gauge how the upcoming adjustment may deviate from published estimates at different stages in a difficulty epoch.
Network difficulty is a quantitative measure of the probability of a miner or mining pool submitting a valid hash with the Bitcoin network’s cryptographic hash function (SHA-256). Higher network difficulty indicates a lower probability of an ASIC submitting a valid hash, meaning it takes more hashrate to produce a valid hash.
Network difficulty is important for hashrate market participants because it is a key determinant of hashprice – the revenue miners can expect to earn from a quantity of hashrate. The more mining on the network, the higher the network difficulty and the smaller the slice of network rewards a miner gets, and vice versa.
Network difficulty is adjusted every 2,016 blocks (approximately every two weeks) to a level that targets an average block time of ten minutes. If network hashrate grows and blocks are found faster than 10 minutes on average, the network difficulty will increase. If network hashrate falls and blocks are found slower than 10 minutes on average, the network difficulty will decrease. This algorithm is set in Bitcoin’s code.
Interestingly, due to an early bug in Bitcoin’s code, the first block in each epoch is excluded from the difficulty adjustment calculation. This means the difficulty adjustment is calculated from 2,015 blocks rather than the expected 2,016 blocks. Since the impact is rather minimal and would require a hard fork to fix, developers have decided to leave it for now.
The methodology behind Hashrate Index’s difficulty adjustment estimate is simple. We will call this formula the constant block time method, which takes the average block time in the most recent epoch, assumes it will persist to the end of the epoch, and provides an estimate on the magnitude of the difficulty adjustment. This estimate is updated with each block that is added. It isn't a particularly sophisticated methodology, but it provides a baseline estimate for market participants and is commonly used by other sources across the industry. An example calculation from Hashrate Index for the upcoming difficulty adjustment is provided below.
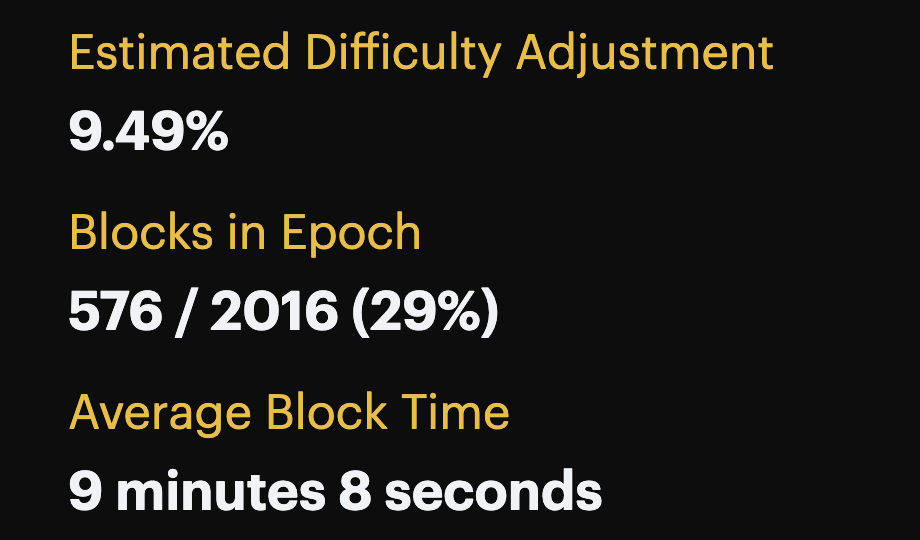
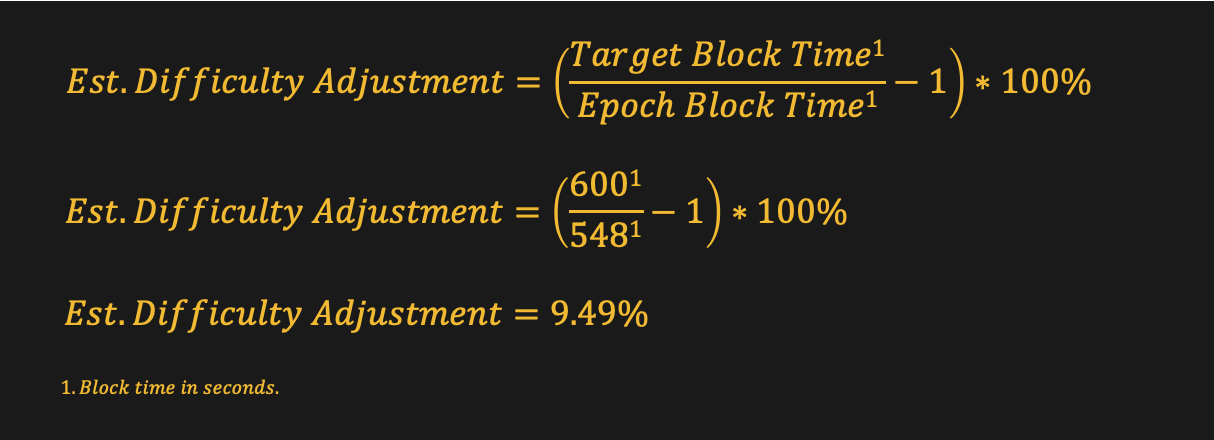
This methodology should become more accurate with each block that is added in the epoch. Ultimately, the actual adjustment is just the formula above at block 2,016 of the current epoch.
To determine the accuracy of Hashrate Index’s difficulty adjustment projections, we analyzed almost four years of data beginning with block 552,384 (December 3, 2018) and ending with block 764,063 (November 20, 2022). This 211,680 block data set includes 105 epochs to evaluate the performance of Hashrate Index’s difficulty adjustment estimate.
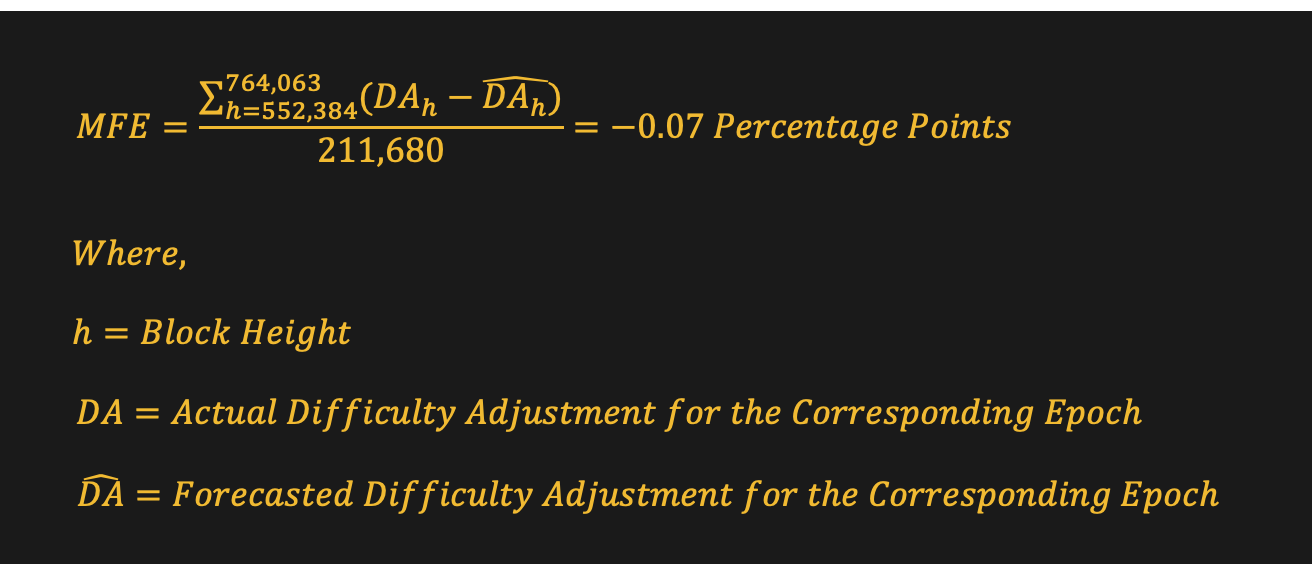
To start, we want to evaluate if Hashrate Index’s projection is over-or-under forecasting on average (i.e., ensure it is unbiased). To do this, we calculate the mean forecast error (MFE) of the difficulty adjustment estimates at each block in the data set. As can be seen in the formula below, MFE is simply an average of the difference between the projection and actual adjustment amount. An MFE close to zero indicates that a forecast is close to correct on average (positive and negative forecasting errors cancel each other out). The small negative value indicates slight over-forecasting – the actual value tends to be 0.07 percentage points less than the forecast values.
However, because positive and negative errors tend to cancel each other out, MFE is not a particularly good measure to forecast accuracy. To get a better forecast, we calculate the mean absolute forecast error (MAFE). This measure avoids the problem of positive and negative forecast errors by taking the average of the absolute difference between the projection and actual adjustment amount. Again, a number closer to zero indicates a more accurate forecast.

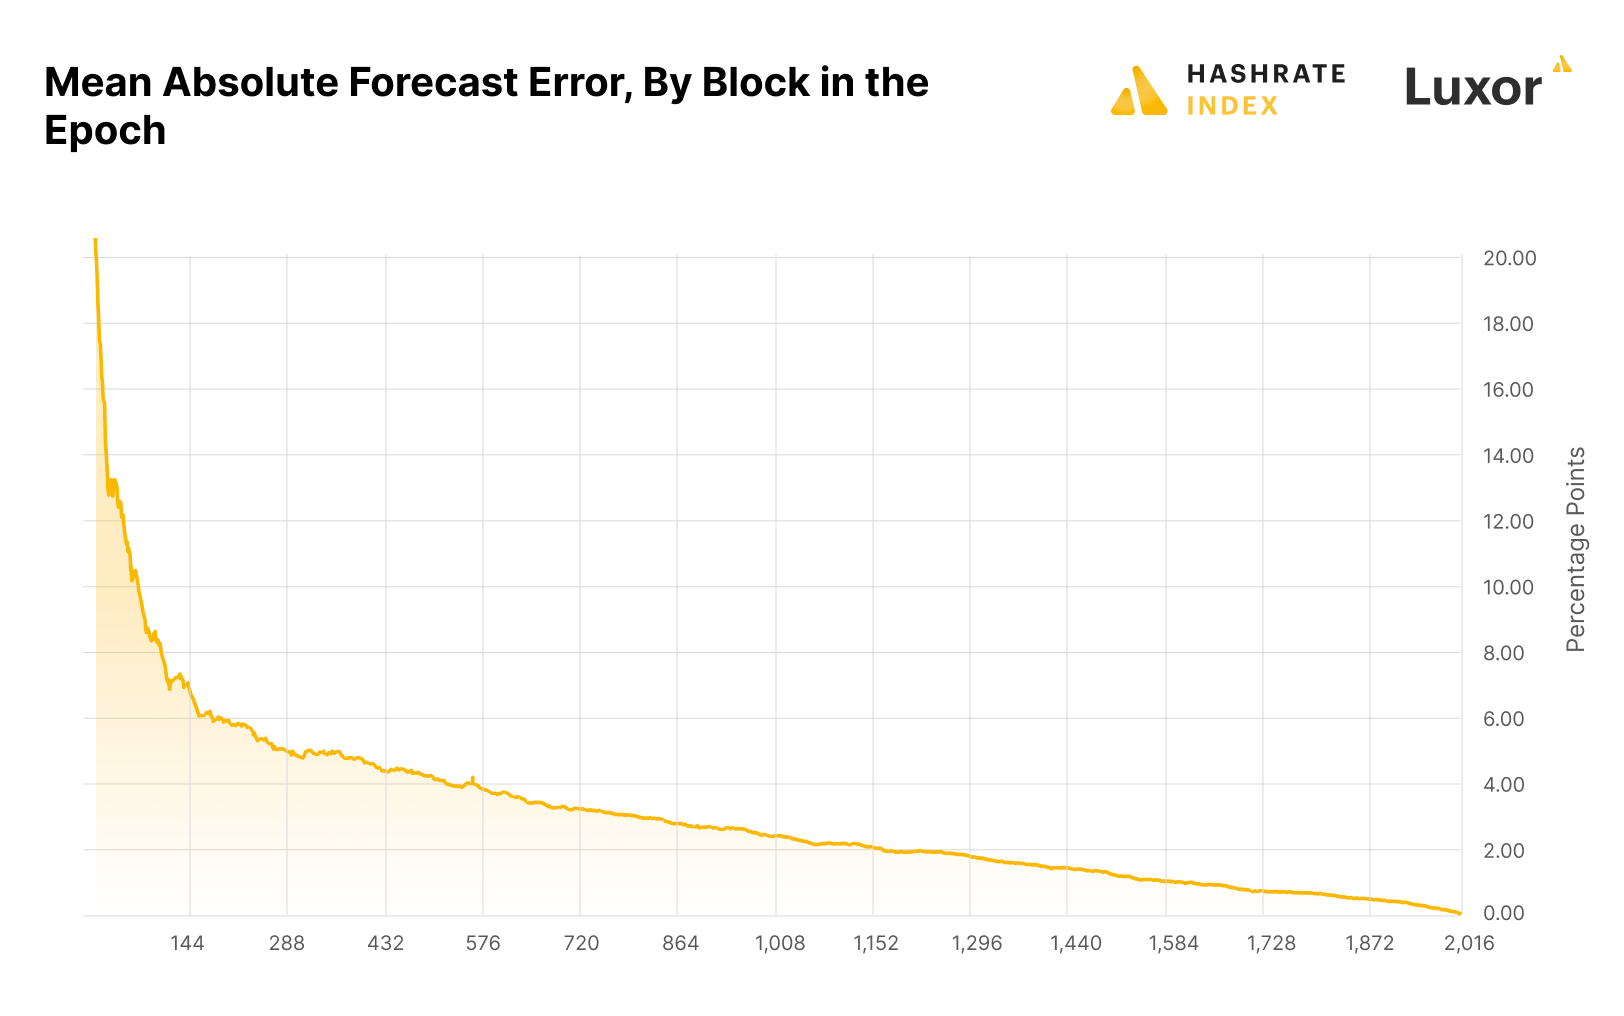
3.65 percentage points is not a particularly accurate MAFE given the average difficulty adjustment over the sample period was 1.89 percentage points. However, as hypothesized, there is tremendous variation in forecast accuracy at different points in the epoch. The chart below shows the MAFE calculation at each block in the epoch. It clearly shows declining forecast errors as the epoch approaches block 2,016.
To construct confidence intervals on Hashrate Index’s difficulty adjustment estimate at each block in the epoch, we calculated the root mean square error (RMSE) at each block in the epoch and multiplied it by a corresponding +/- z-score. As can be seen in the formula below, this is a measure similar to standard deviation, but for comparing forecasted values to actual outcomes.
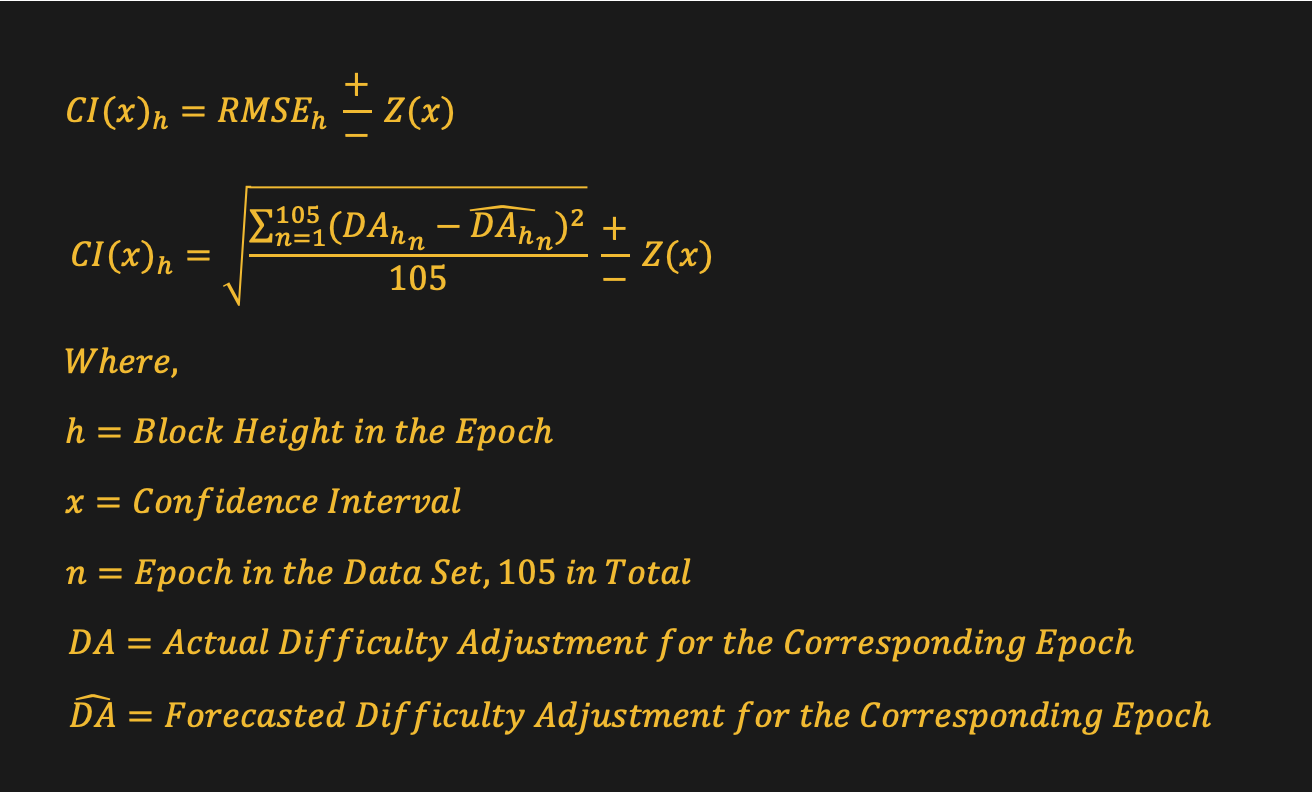
The following chart shows 90%, 95%, and 99% confidence intervals for Hashrate Index’s estimated difficulty adjustment at each block in the epoch.
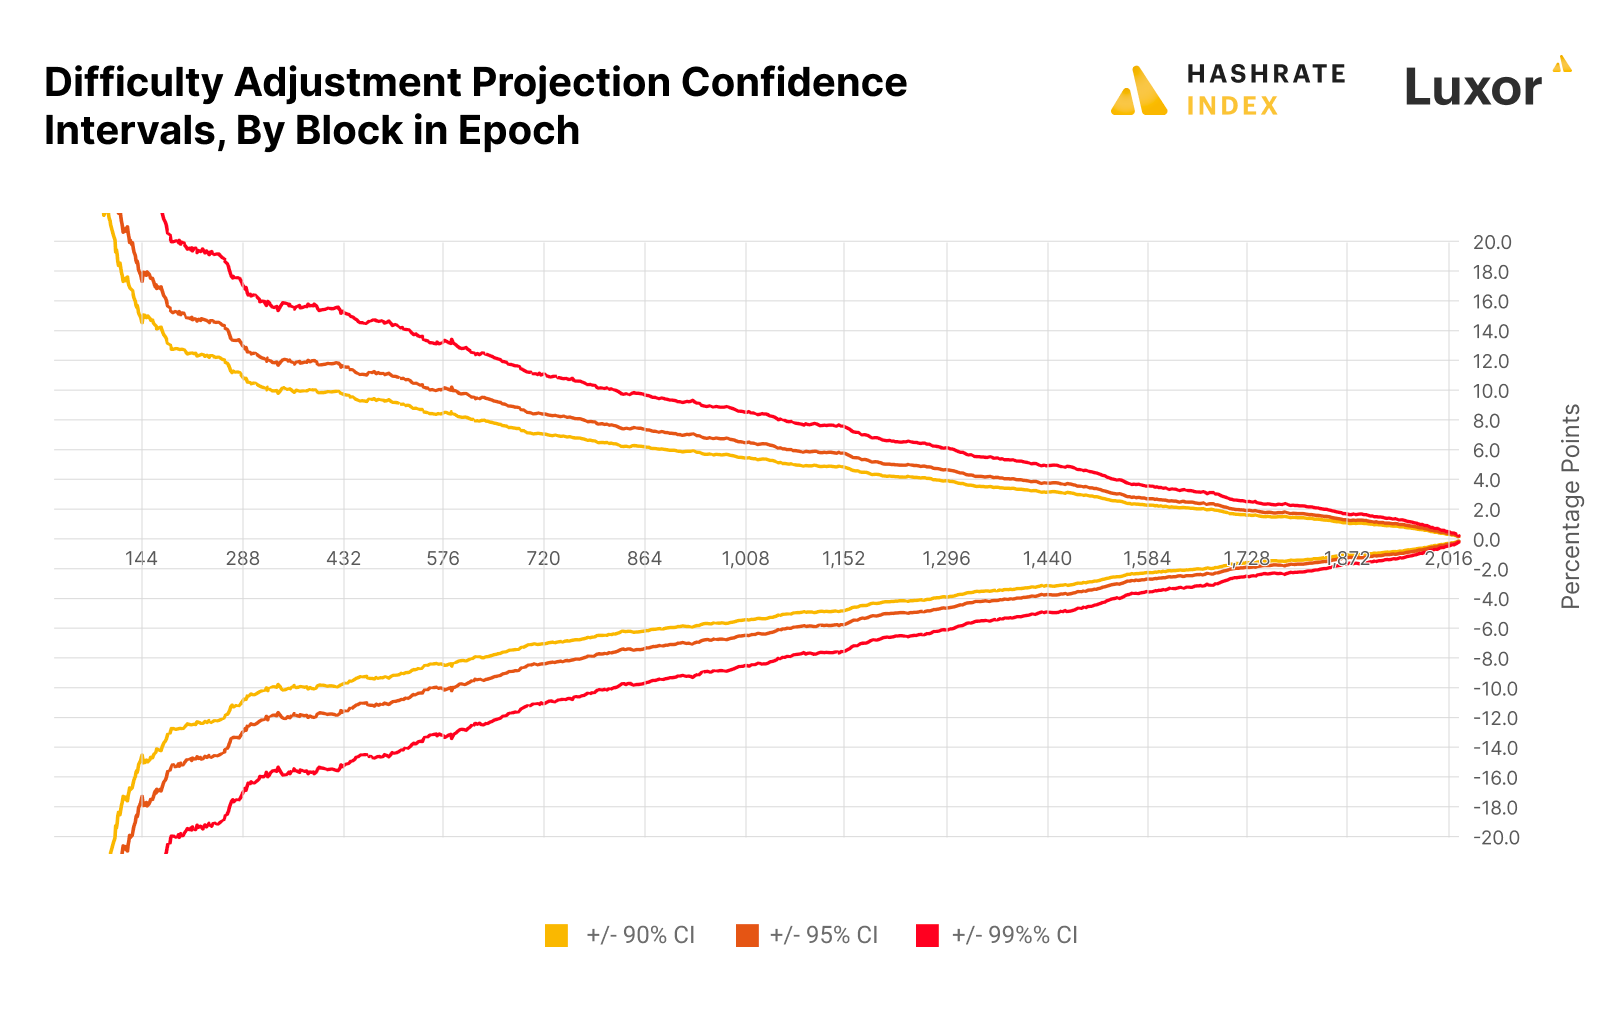
This chart shows that early in the epoch, we should not have much confidence in the forecasted difficulty adjustment. Using the example above, of an estimated 9.49% difficulty adjustment at block 576, this data indicates we can only be 95% confident the actual adjustment will be between -0.51% and 19.49% (i.e., +/- 10.0 percentage points).
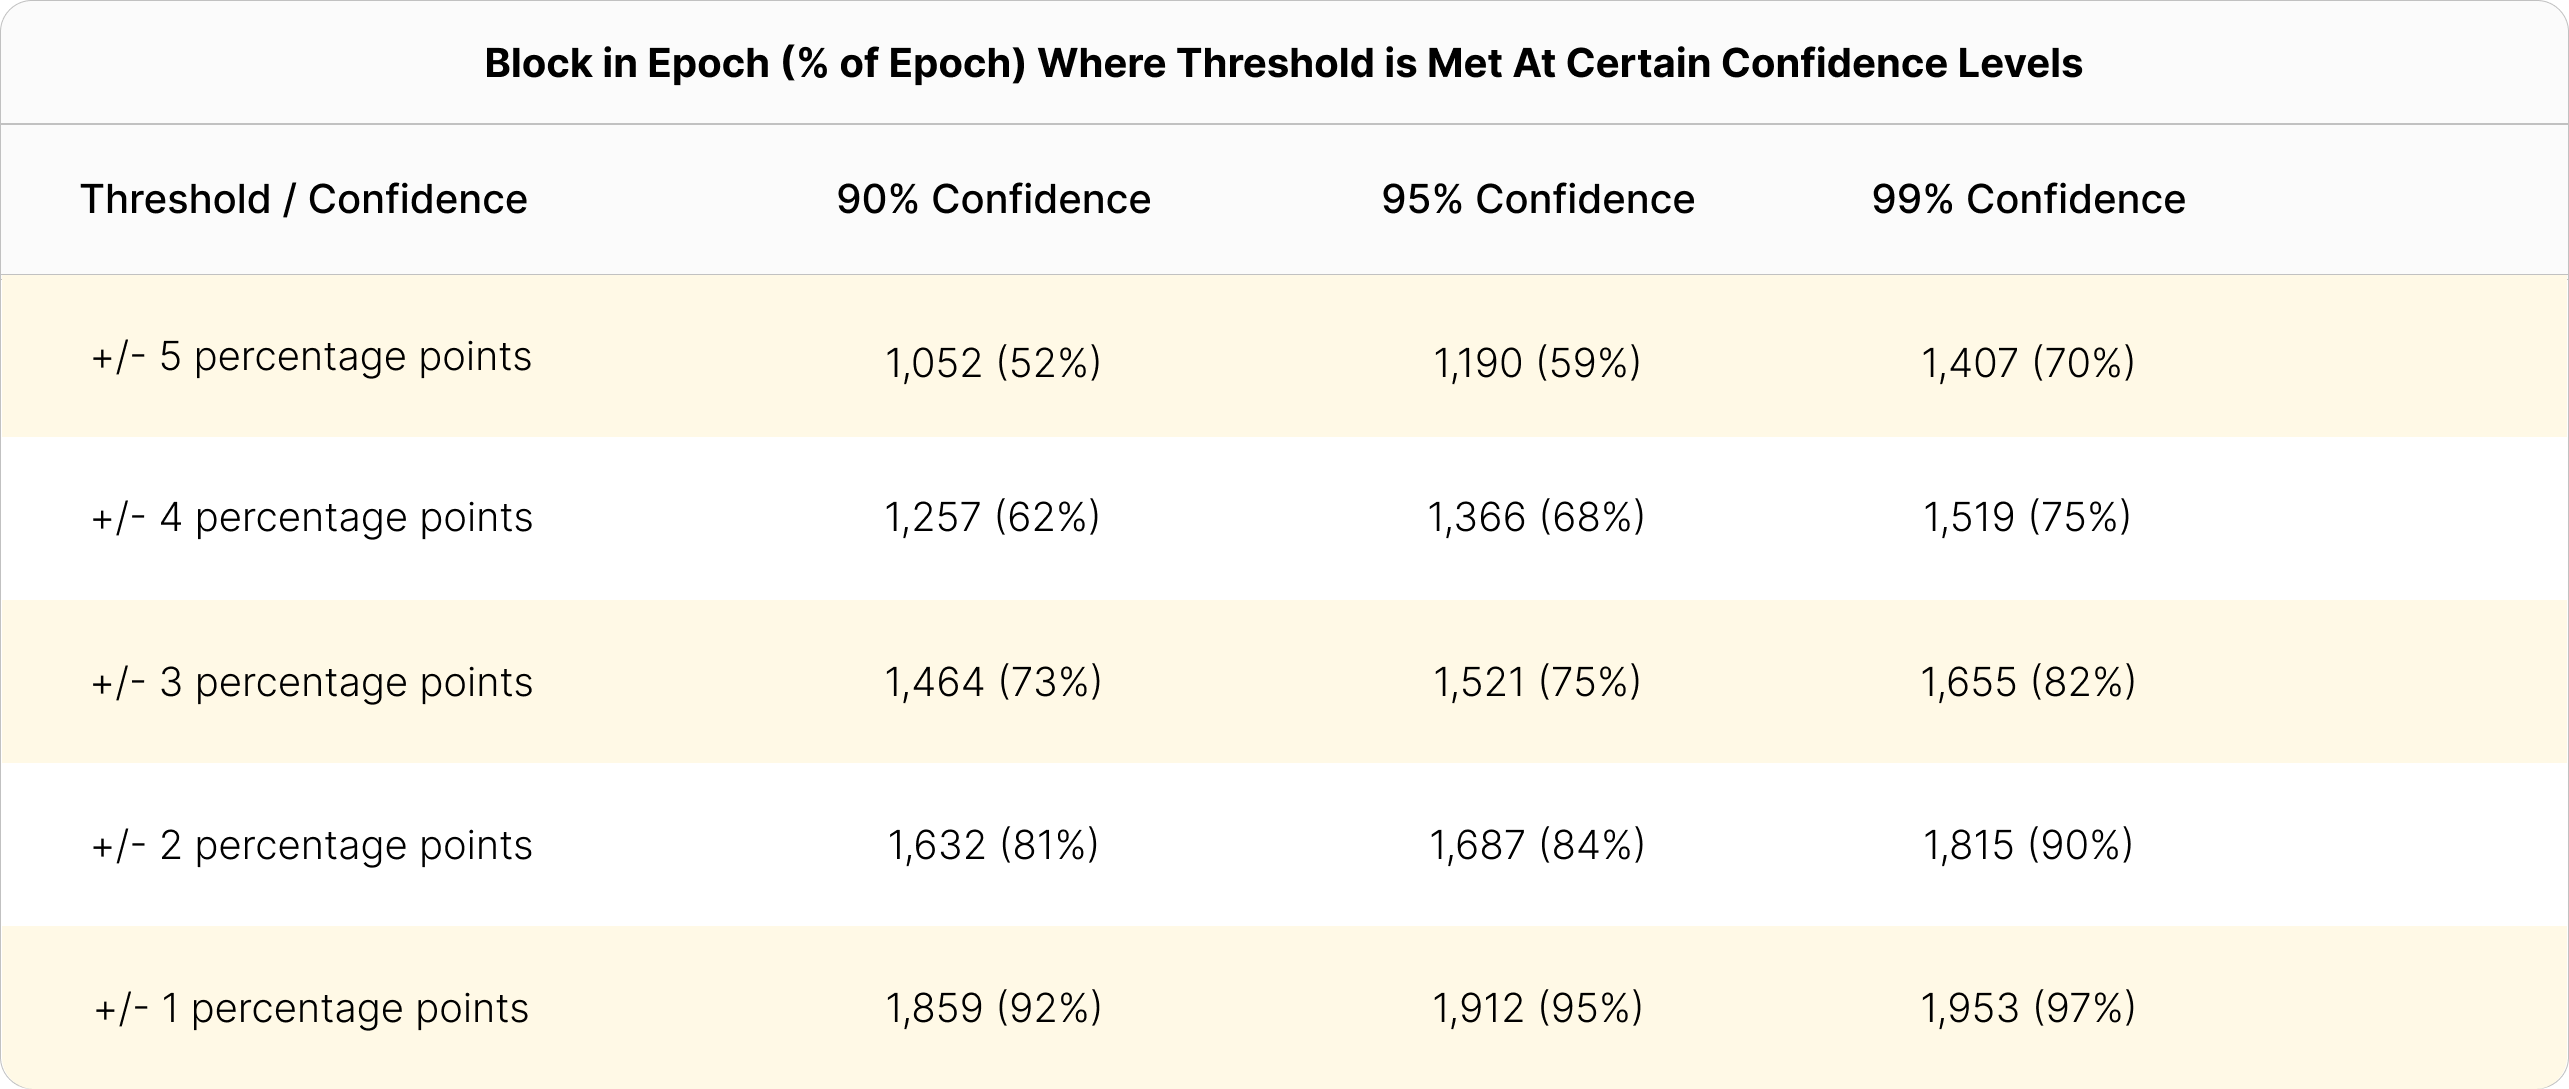
However, as the epoch progresses the forecast accuracy increases. The table below summarizes key confidence interval thresholds at different stages in the epoch. These may serve as rules of thumb for market participants.
There are a number of takeaways from this analysis. In particular:
This content is for informational purposes only, you should not construe any such information or other material as legal, investment, financial, or other advice. Nothing contained in our content constitutes a solicitation, recommendation, endorsement, or offer by Luxor or any of Luxor’s employees to buy or sell any derivatives or other financial instruments in this or in in any other jurisdiction in which such solicitation or offer would be unlawful under the derivatives laws of such jurisdiction.
There are risks associated with trading derivatives. Trading in derivatives involves risk of loss, loss of principal is possible.
Do you have any questions?
Please contact our support team